A simple way to find hotspots with Python
I've just finished Legacy Code: First Aid Kit by Nicolas Carlo.
I loved it:
- it's clear and concise (no random blabla to fill the pages)
- it focuses on the underlying principles (and go beyond buzzwords)
- it's very practical
The book expose 14 cohesive techniques.
The first one is about identifying hotspots when you approach a codebase.
Hotspots are parts of your program that are complex, and where the team spend a lot of time.
Hotspots are great candidates for refactoring.
Here is how to visualize them on a python codebase.
Compute the churn
The churn is a measure of "where things move".
You can get it by counting how many times a file has been edited the last year.
To get this information, git is your friend :
git log --format=format: --name-only --since=12.month \
  | egrep -v '^$' \
  | sort \
  | uniq -c \
  | sort -nr \
  | head -10
On django's codebase, it gives:
28 django/db/models/base.py
19 tests/admin_views/tests.py
19 django/db/models/sql/compiler.py
19 django/db/models/expressions.py
17 tests/migrations/test_operations.py
16 django/db/models/query.py
15 tests/mail/tests.py
15 django/db/models/sql/query.py
14 django/db/models/constraints.py
13 django/utils/html.py
Now, let's tweak it to send the result in a csv:
git log --format=format: --name-only --since=12.month \
    | egrep -v '^$'  \
    | sort \
    | uniq -c  \
    | egrep "\.py$" \
    | sort -nr \
    | awk 'BEGIN {print "filename,churn"} {gsub(/^[ \t]+/, "", $0); print $2","$1}' \
    > churn.csv
Hotspots according to lines of code (LOC)
The simplest complexity metrics for a file is the number of lines of code it has.
The LOCs.
To get this information for each file, you can use cloc:
brew install cloc
cloc . --match-f='\.py$' --by-file --csv --out=loc.csv
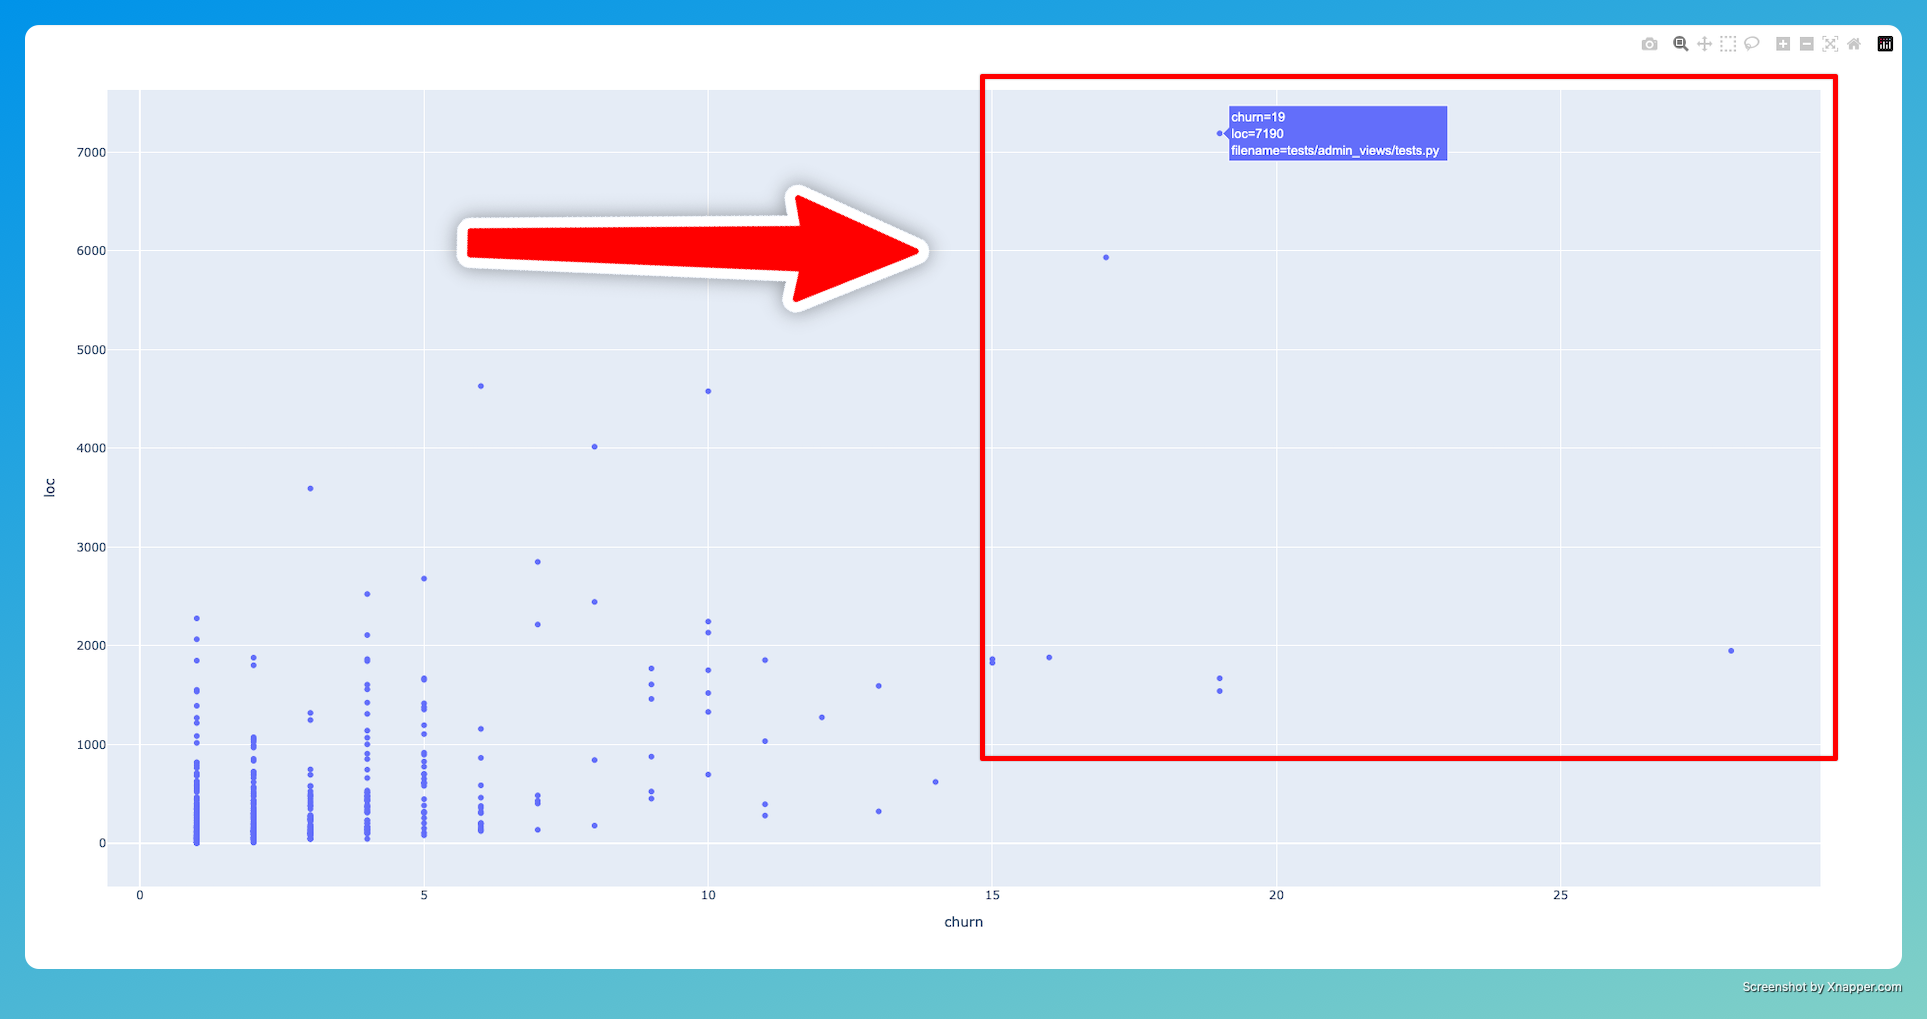
Then, lets plot the LOCs against the churn:
from pathlib import Path

import pandas as pd
import plotly.express as px


churns = pd.read_csv("churn.csv")[["filename", "churn"]]
locs = pd.read_csv("loc.csv")[["filename", "code"]].rename(columns={"code": "loc"}).dropna()
locs["filename"] = locs["filename"].apply(lambda path: Path(path).as_posix())
hotspots = pd.merge(churns, locs, on="filename")

fig = px.scatter(hotspots, "churn", "loc", hover_data="filename")
fig.write_html("hotspots_with_loc.html")
fig.show()
and, voilà :
Hotspots according to cyclomatic complexity
The cyclomatic complexity is given by the number of path a program can take.
A program with a single path is linear and is easy to understand.
A programs with a lot of forks can take many paths. It makes it mentally demanding to follow, easy to mis-understand, and risky to change.
To measure the cyclomatic complexity of your files, you can use radon:
pip install radon
radon cc . -j -O complexity.json
where:
.is the current directory-jformat the output injson-Oindicates the output file
And finally, here is a script to plot the hotspots:
import json

import pandas as pd
import plotly.express as px


def read_complexity(filepath: str) -> pd.DataFrame:
    with open(filepath) as f:
        d = json.load(f)
        rows = []
        for filename, file_stats in d.items():
            if "error" in file_stats:
                continue
            nb_elements = len(file_stats)
            file_complexity = 0
            for component in file_stats:
                file_complexity += component['complexity'] / nb_elements
            rows.append((filename, file_complexity))

    return pd.DataFrame(rows, columns=["filename", "cyclomatic_complexity"])


churns = pd.read_csv("churn.csv")[["filename", "churn"]]
ccs = read_complexity("complexity.json")
hotspots = pd.merge(churns, ccs, on="filename")

fig = px.scatter(hotspots, "churn", "cyclomatic_complexity", hover_data="filename")
fig.write_html("hotspots_with_cyclomatic_complexity.html")
fig.show()
Here it is !
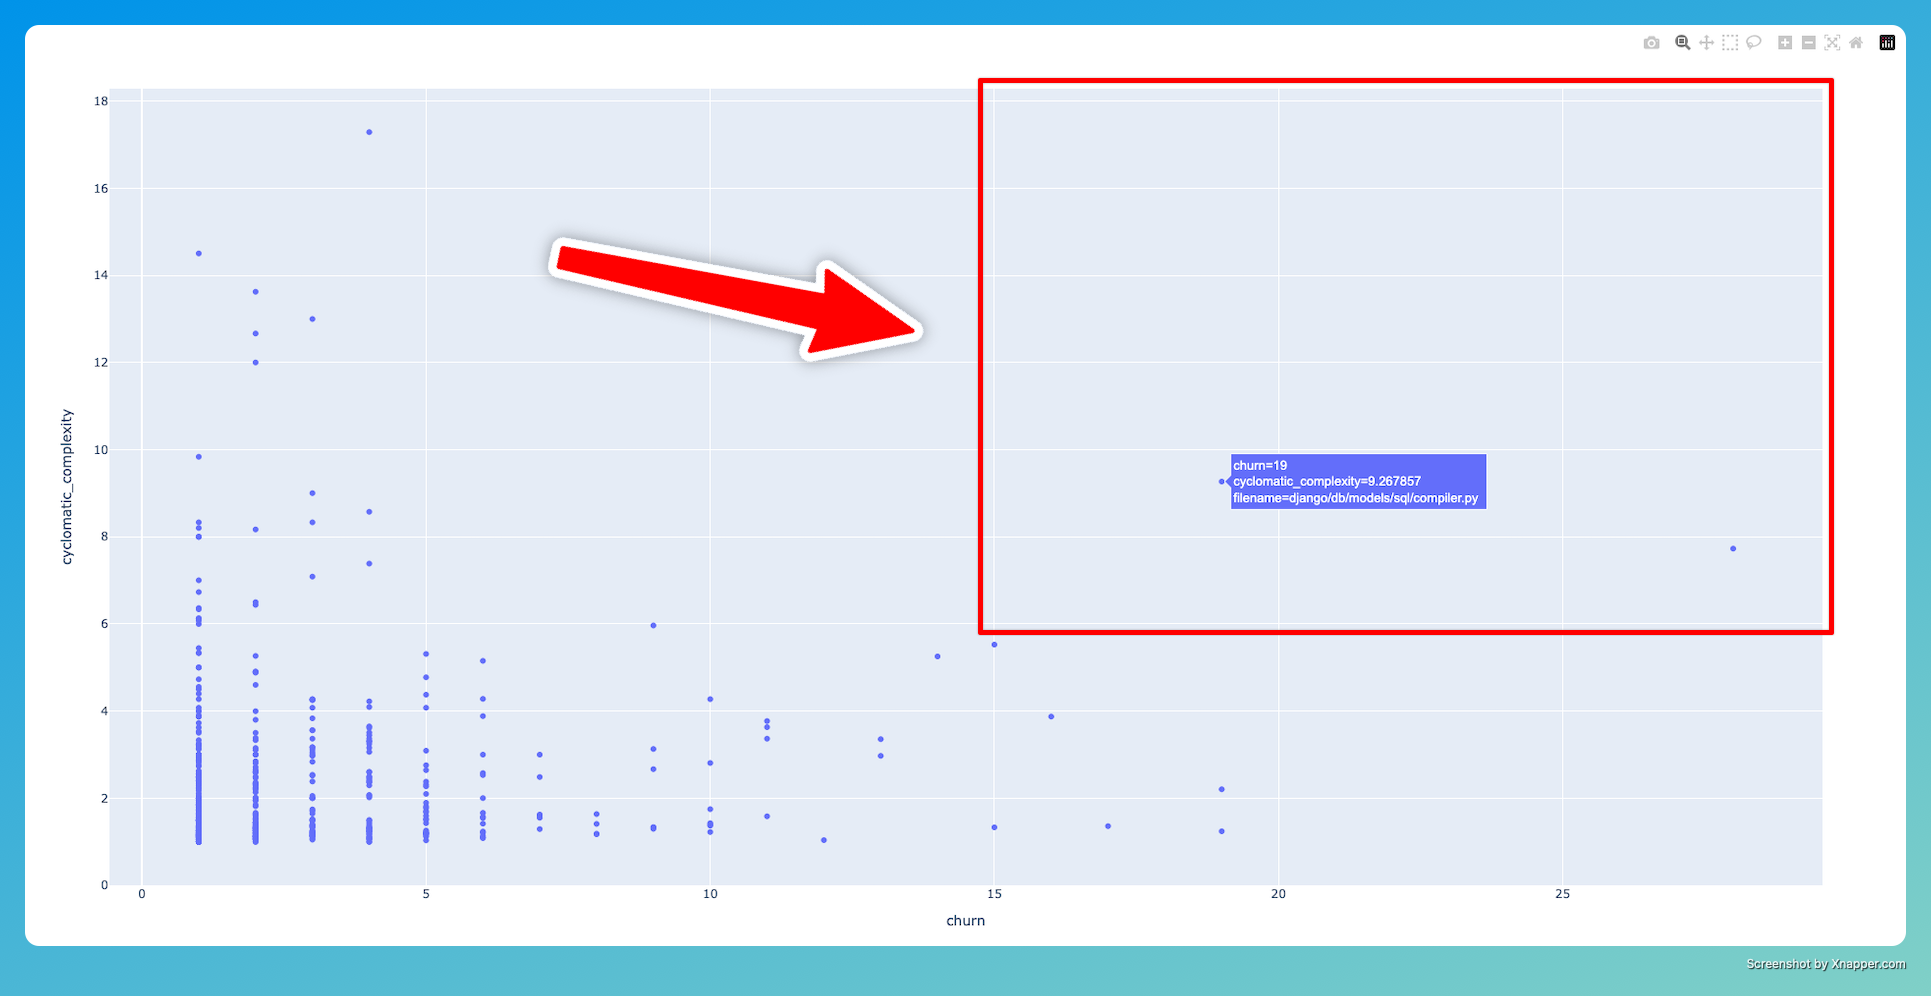
At first glance, the codebase looks healthy.
Leave a reply